
Globally, researchers and funding bodies are increasingly required to communicate the impact of their activities to society and demonstrate the return on investment. The Kids Research Institute Australia is developing a new approach to tracking the progress of research towards real world impacts over time.
This novel software solution Momentum Empowering Impact (Momentum) enables researchers to show progress in a manner which is relevant to stakeholders including funding bodies, philanthropy, government, industry and community.
![]()
The impact challenge
Research often takes a long time and there is a need to understand how the research is progressing towards impact during the research process.
Funders and stakeholders want to understand how their support helps solve big research problems.
“Where does my funding go?”
Researchers want to be able to tell funders and stakeholders what they are doing with their support.
“How do I get funders to understand my research and continue to support me”
Momentum, rising to the challenge
Stakeholders and funders usually hear about research impact in the form of case studies and metrics, but these fail to show how research is progressing towards impact at any given time.
By contrast, Momentum connects stakeholders and funders with researchers in an easy and intuitive way to track research as it progresses along a pathway towards an intended impact, rather than retrospectively at the end of the research process.
Rise with us
At The Kids Research Institute Australia our leadership and researchers are committed to making Momentum a reality that we can share with other organisations. If you would like to know more about Momentum or if you would like to partner with us on our journey, please contact as at impact@telethonkids.org.au.
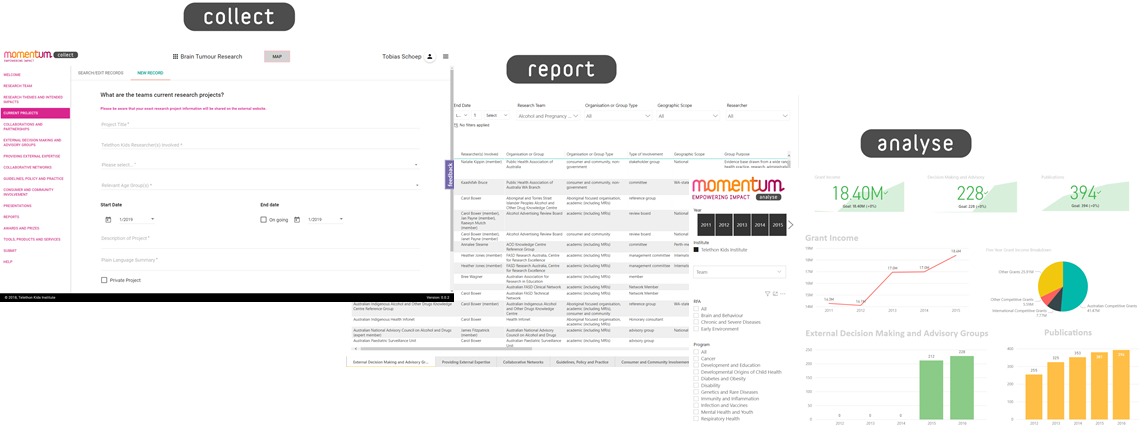
Easily track research progress with visual reports and graphs