Search
Tuberculosis (TB) remains a major public health challenge in Ethiopia, despite being a preventable disease. TB preventive treatment (TPT) is a critical intervention to prevent the progression from latent TB infection to active disease, particularly among household contacts of TB patients and people living with HIV due to weakened immunity. However, the initiation and completion rates of TPT at subnational and local levels have not been thoroughly investigated. This study aims to map facility-based TPT initiation and completion rates among household contacts of TB across Ethiopia.
Malaria incidence (MI) has significantly declined in Nepal, and this study aimed to investigate the spatiotemporal distribution and drivers of MI at the ward level. Data for malaria cases were obtained from the National Surveillance System from 2013 to 2021. Data for covariates, including annual mean temperature, annual mean precipitation, and distance to the nearest city, were obtained from publicly available sources. A Bayesian spatial model was used to identify factors associated with the spatial distribution of MI.
Quantifying the extent to which previous infections and vaccinations confer protection against future infection or disease outcomes is critical to managing the transmission and consequences of infectious diseases. We present a general statistical model for predicting the strength of protection conferred by different immunising exposures (numbers, types, and strains of both vaccines and infections), against multiple outcomes of interest, whilst accounting for immune waning.
Arboviruses transmitted mainly by Aedes (Stegomyia) aegypti and Ae. albopictus, including dengue, chikungunya, and Zika viruses, and yellow fever virus in urban settings, pose an escalating global threat. Existing risk maps, often hampered by surveillance biases, may underestimate or misrepresent the true distribution of these diseases and do not incorporate epidemiological similarities despite shared vector species.
Post-tuberculosis (TB) sequelae present a significant challenge in the management of TB survivors, often leading to persistent health issues even after successful treatment. Identifying risk factors associated with post-TB sequelae is important for improving outcomes and quality of life of TB survivors. This systematic review and meta-analysis aims to identify risk factors associated with long-term physical sequelae among TB survivors.
The clinical development of novel vaccines, injectable therapeutics, and oral chemoprevention drugs has the potential to deliver significant advancements in the prevention of Plasmodium falciparum malaria. These innovations could support regions in accelerating malaria control, transforming existing intervention packages by supplementing interventions with imperfect effectiveness or offering an entirely new tool.
o map subnational and local prevalence of drug-resistant tuberculosis (DR-TB) across Africa. We assembled a geolocated dataset from 173 sources across 31 African countries, comprising drug susceptibility test results and covariate data from publicly available databases. We used Bayesian model-based geostatistical framework with multivariate Bayesian logistic regression model to estimate DR-TB prevalence at lower administrative levels.
Although most people born this century will be educated in African schools, these schools often lack basic infrastructure, such as electricity and/or lighting. In the face of a rapidly growing school-age population in Africa, the electrification of educational facilities is not just an infrastructural challenge but also a pivotal investment in the continent’s future workforce.

Children who live in the outer suburbs of Australia’s four biggest cities are twice as likely to have asthma as those living in inner city areas, according to a new study based on health data captured in the last Australian Census.
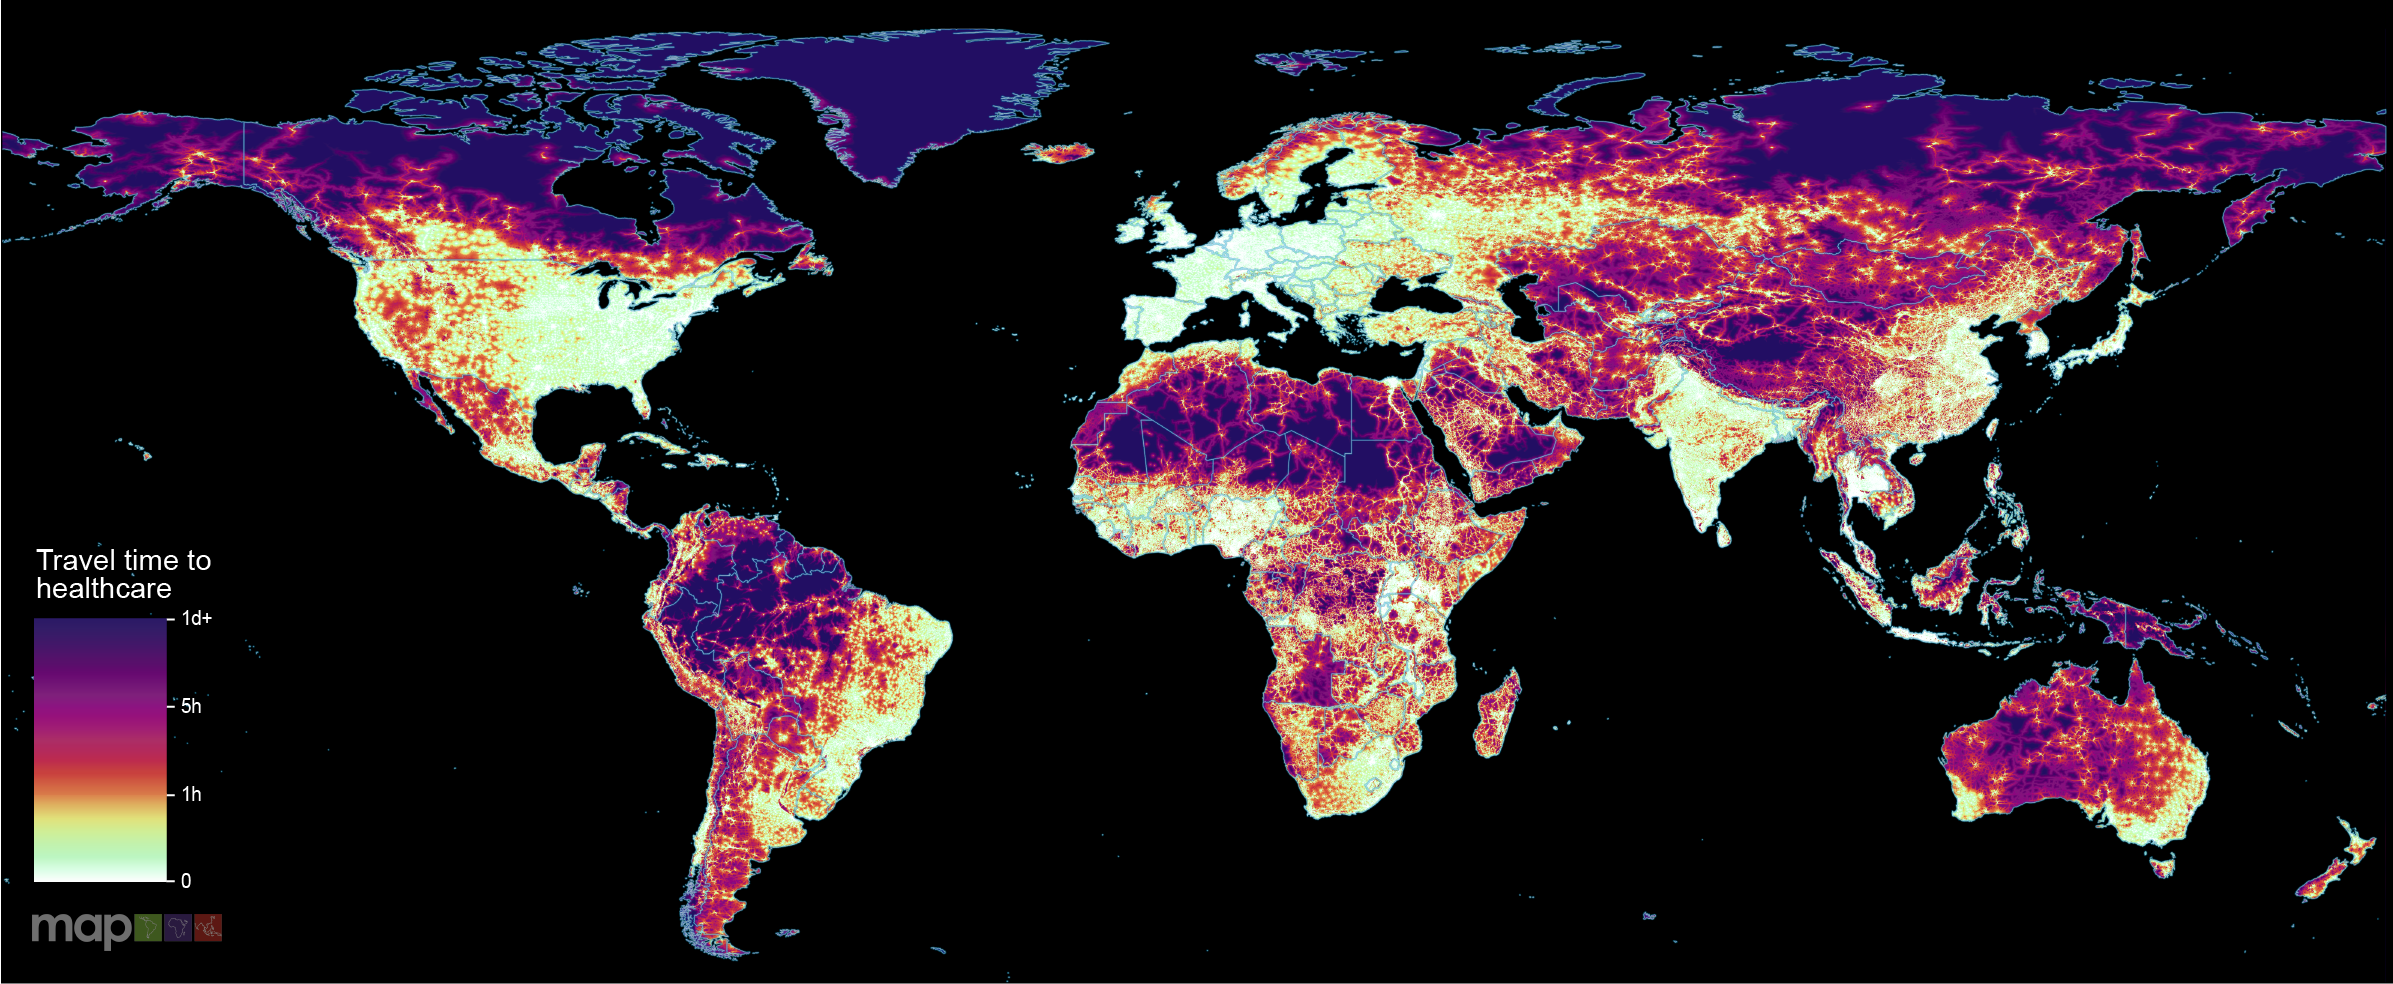
New research which maps the entire global population’s travel time to their nearest healthcare facility has revealed major inequalities in access to healthcare depending on whether people have access to motorised transport or not.